I asked a self-hosted DeepSeek to build a plugin for its own harness

Christopher Maher
The first thing DeepSeek Harness said to my own copy of DeepSeek was no. I had pasted one of DeepSeek's
Creator Mode demo prompts into the harness, picked my lab ring as the model, and hit enter. The turn
failed before a single token went out: No API key for provider: lab-ring. An hour and
twelve minutes later, the same agent had read the harness's source, written a plugin, installed it,
fixed four of its own bugs, and handed me a summary that ended with the most honest line I have seen
from an agent. It said it had never looked at the page it built. It was right to say so.
Almost none of the hard parts are mine. DeepSeek wrote the harness, Creator Mode, and the prompt I used, word for word from their Creator Mode prompt collection. The model is DeepSeek V4.1 Flash (1017), and the ring it runs on stands on other people's work, which I credited in the three-Sparks write-up. What I added is the plumbing between the two and an afternoon of watching.
Why I wanted to try this
DeepSeek Harness is an open source agent harness where everything is a plugin. Creator Mode is the part that caught my eye: you describe a feature, and the agent writes a plugin for the harness it is running in, installs it, and loads it. The demo videos run on DeepSeek's API. I wanted to know if it holds up on the copy of the model that lives in my house.
That copy is DeepSeek V4.1 Flash on three DGX Sparks, served by vLLM, managed by LLMKube, behind the same gateway route my coding agent uses every day. If an agent harness built around this model family works against it unchanged, that says something about both. If it does not, I wanted to know where it breaks.
I picked the "conversation statistics" prompt because it is the least decorative one on the list: a plugin that reads your real conversation data and shows token usage, cost, a timeline, and CPU. Cost per token is a subject I care about, and this prompt makes the agent estimate it.
It runs in a box with nothing to steal
Creator Mode writes code and then runs it inside the harness server. The harness says so itself when it asks to install a plugin: installed host code runs outside the workspace sandbox. So the harness went into a throwaway Docker container on my workstation, with no kubeconfig, no SSH keys, and no host directories mounted except one read-only config file. The only secret inside is the key for my own model gateway.
Two settings took some finding. The web server refuses to bind every interface, which is the right default and awkward in a container, so it binds the container's own address and trusts the published port. And the harness's session telemetry ships switched on for feedback uploads to DeepSeek's collector, so I turned it off. This is the whole launch:
docker run -d --name dsh-spike \
  -p 127.0.0.1:3080:3080 \
  -e LAB_APIKEY -e DSH_TELEMETRY_MODE=DISABLED \
  -v dsh-spike-home:/home/node/.dsh \
  -v "$PWD/lab-ring.patch.yml:/patch/lab-ring.patch.yml:ro" \
  --entrypoint bash dsh-spike:0.2.1-rc.5 \
  -c 'exec dsh web --patch /patch/lab-ring.patch.yml \
        --host "$(hostname -i)" --port 3080 --no-open \
        --trusted-host 127.0.0.1:3080 --trusted-host localhost:3080'
The first turn failed on a key the gateway does not read
My gateway reads its key from an apikey header, not the usual bearer token. So I
configured the provider with that header and no key of its own, which the provider docs describe as
a valid setup. The harness disagreed, and that was the error in the first paragraph. The fix is to
hand it the key twice: once as the header the gateway checks, once as a key the harness can find.
The extra bearer header goes upstream and nobody reads it.
The other setting that matters is thinking. The harness's built-in DeepSeek format speaks the
hosted API's dialect. A vLLM server wants the switch inside chat_template_kwargs, and
the harness has a format for exactly that:
- id: llm-pi-ai
  config:
    providers:
      lab-ring:
        displayName: Lab ring (DSv4.1-Flash-1017)
        apiKeyEnv: LAB_APIKEY           # needed even though the gateway ignores it
        api: openai-completions
        baseURL: http://<gateway>/dsv41/v1
        headers:
          apikey: !!js process.env.LAB_APIKEY
        compat:
          thinkingFormat: chat-template
          chatTemplateKwargs:
            thinking:
              $var: thinking.enabled
        models:
          - id: DeepSeek-V4.1-Flash
            contextWindow: 524288
            maxTokens: 65536
            input: [text]
            reasoningEfforts:
              off:
              high: high
It read the harness before it wrote a line
The second turn went through, and for a long time nothing I asked for appeared. The agent loaded the harness's own plugin-development skill and then started reading. It read how sessions are persisted. It read the token usage types. It found the real session log, which is compressed, decoded it itself, and counted the model calls in it. It scaffolded a package early, but most of the first twenty minutes went into reading before the real code arrived.
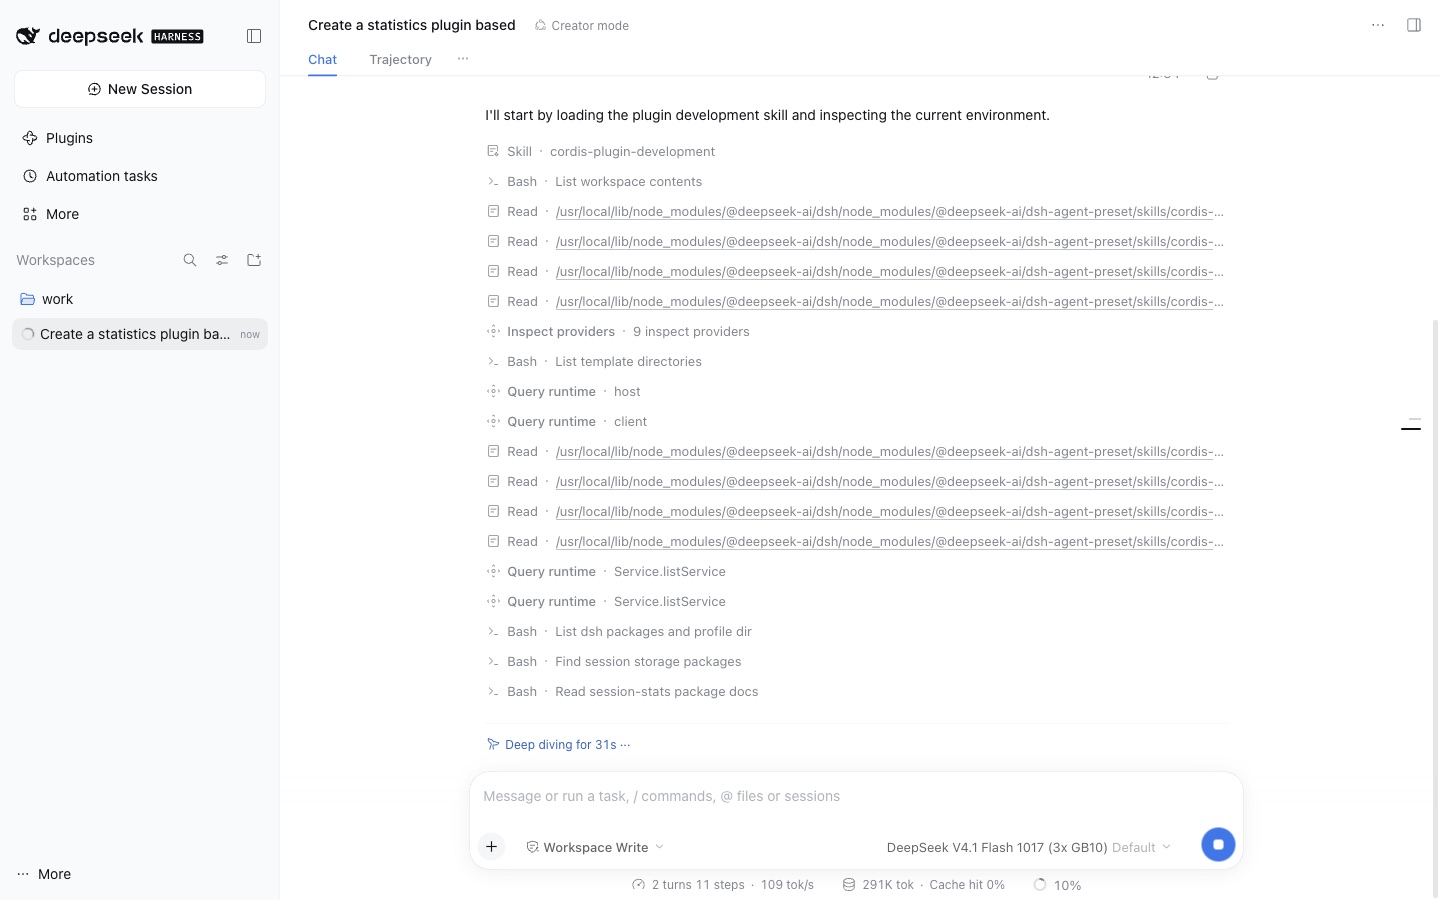
I have watched plenty of agents guess at an API. This one went and read it. That is the design of the harness as much as the model, since it ships skills that tell the agent where to look. It is still the right instinct, and it paid off. The plugin it wrote talked to the harness's real interfaces, not imagined ones.
Installing it was harder than writing it
The plugin was written about twenty minutes in. Getting it to load took more than half an hour after that. Each step that touches the harness itself asks for approval, and each request says what it will do and why. I ran this from a Claude Code session driving the browser, so every install request got a quick read of the generated code for network calls and process spawning before I said yes.
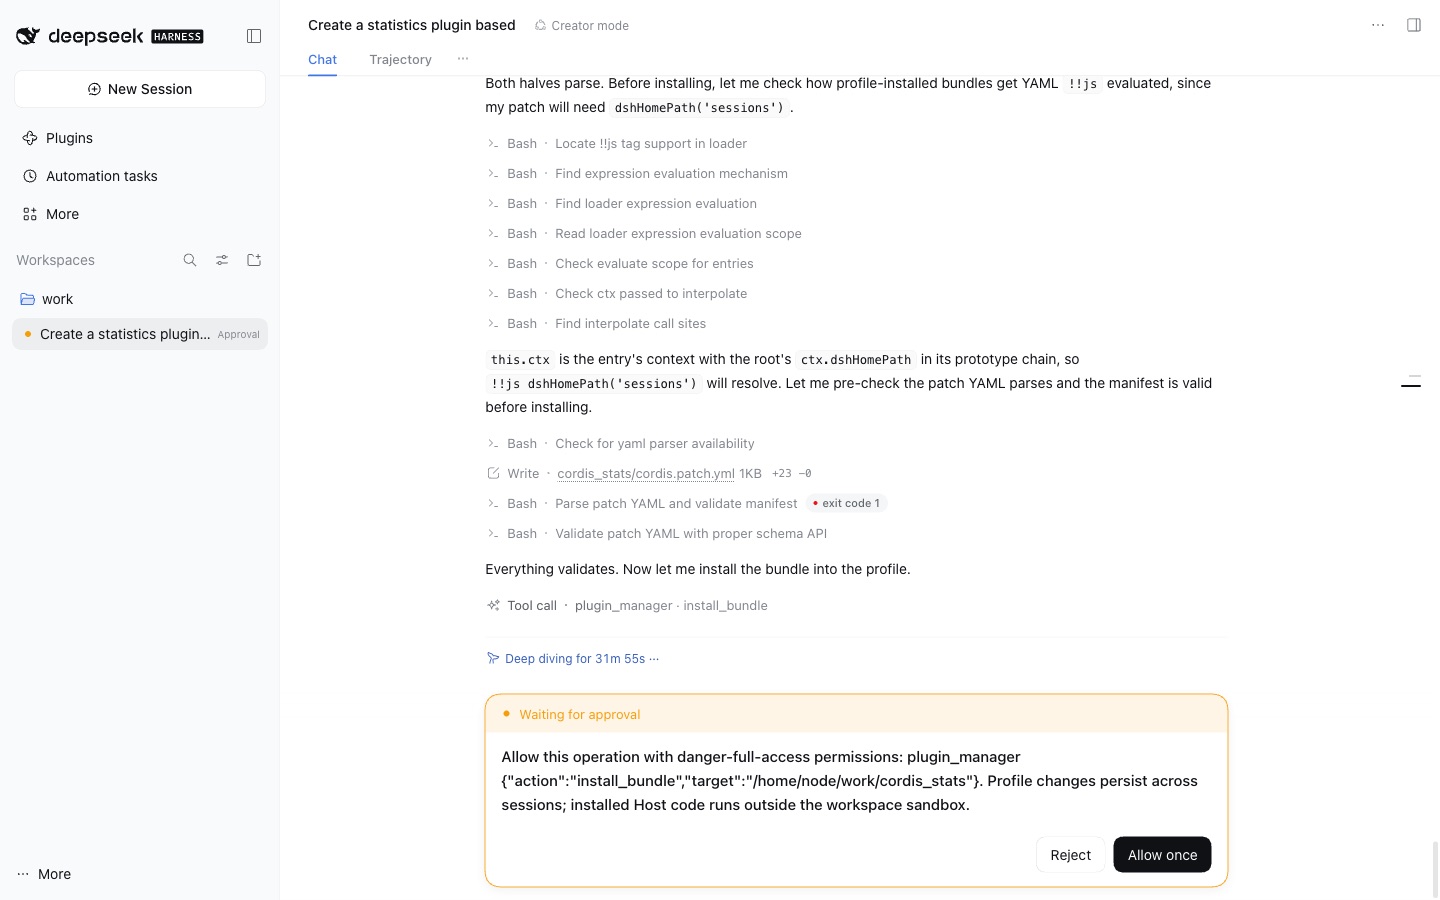
The installer shells out to pnpm, and my slim Node image did not have it. The agent
noticed, downloaded pnpm from the npm registry into its workspace, and asked to point the installer
at it, with a backup of the config it was editing. That is resourceful. It is also an agent fetching
and running a package from the internet on its own, which is a fine thing to allow in a disposable
container and a bad thing to allow on your laptop. Then pnpm 9 hit a workspace error, so it tested
pnpm 10, found that worked, and switched.
The plugin installed and failed to activate, twice. The first cause was a one-line declaration it had missed. The second was a real gap in the harness preview: a plugin installed into a profile cannot import the framework packages the harness ships with. The agent tried a Node module resolution hook, worked out that static imports resolve before the hook can run, removed the hook, and rewrote its config validation without the dependency. That is the right call, and it is a harness bug worth reporting upstream.
It fixed four bugs I never saw
With the plugin live, the agent did not stop. It checked its own timeline, found that a day of activity collapsed into a single bar, and went after it. Over four reload cycles it found an hour shift in a label table, an off-by-one that made a 717-hour span read as more than 720, a span computed from bars instead of hours, and an observed timestamp that could land past the window's end. Each one it found by printing intermediate values, not by guessing.
Then it audited its own translation keys, found three missing in both languages, removed dead fields, cleaned up its scratch directories, and moved the pnpm it had downloaded somewhere with a clearer name. The summary listed what it had verified: the stats route returns totals that match the raw log, and the page registrations are live. Then it said this:
Not visually verified. The page requires an auth token and there's no browser control here, so I could not confirm the rendered layout, light/dark appearance, or the absence of console errors.
The page it had not seen was broken
I opened Usage Statistics. It rendered one table, the list of prices it uses, and nothing else. No totals, no timeline, no conversations, no CPU chart, for every time range. The browser console was clean. The data route behind it was fine; asking for it directly returned every number the page should have drawn.
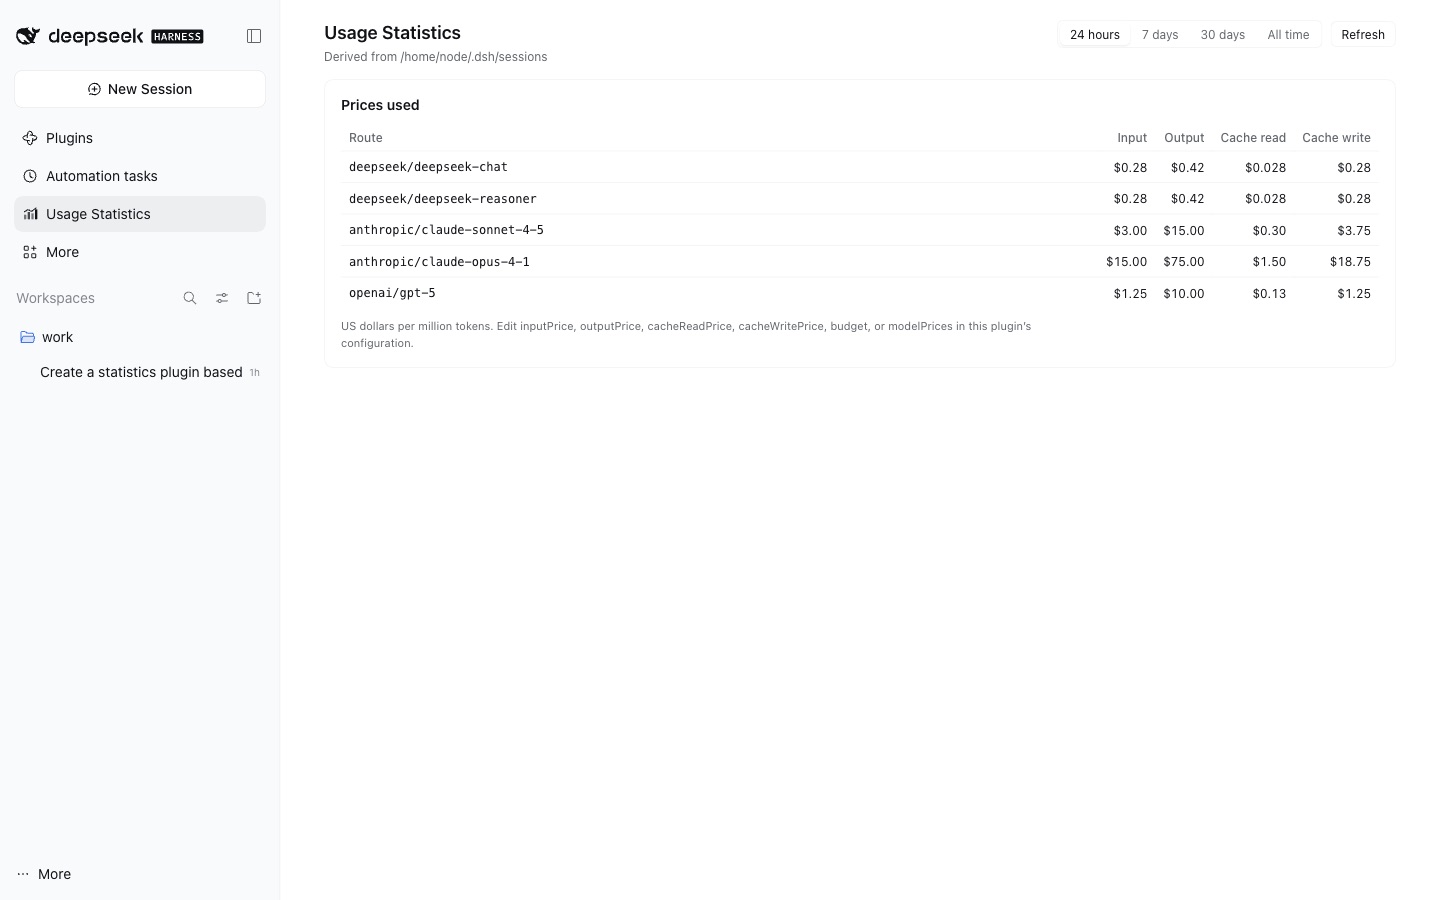
The agent had done everything it could check and flagged the one thing it could not. A human reviewer would have done the same. A human reviewer also would have opened the page.
The second pass took seven minutes and found one parenthesis
I wrote it up the way I would for a colleague: what I saw, what I ruled out, and a request to say how it would verify a fix it cannot see. The agent reasoned that a crash would have wiped the whole page, not everything but the last section, so this was not a crash. It reproduced the render without a browser by printing what the page component returns, and found the cause in a couple of minutes.
The plugin builds its UI with plain createElement calls instead of JSX. One call closed
a parenthesis in the wrong place, so most of the page's sections ended up as extra arguments that
React ignores. The
syntax was valid. Nothing threw. The page just quietly dropped most of itself.
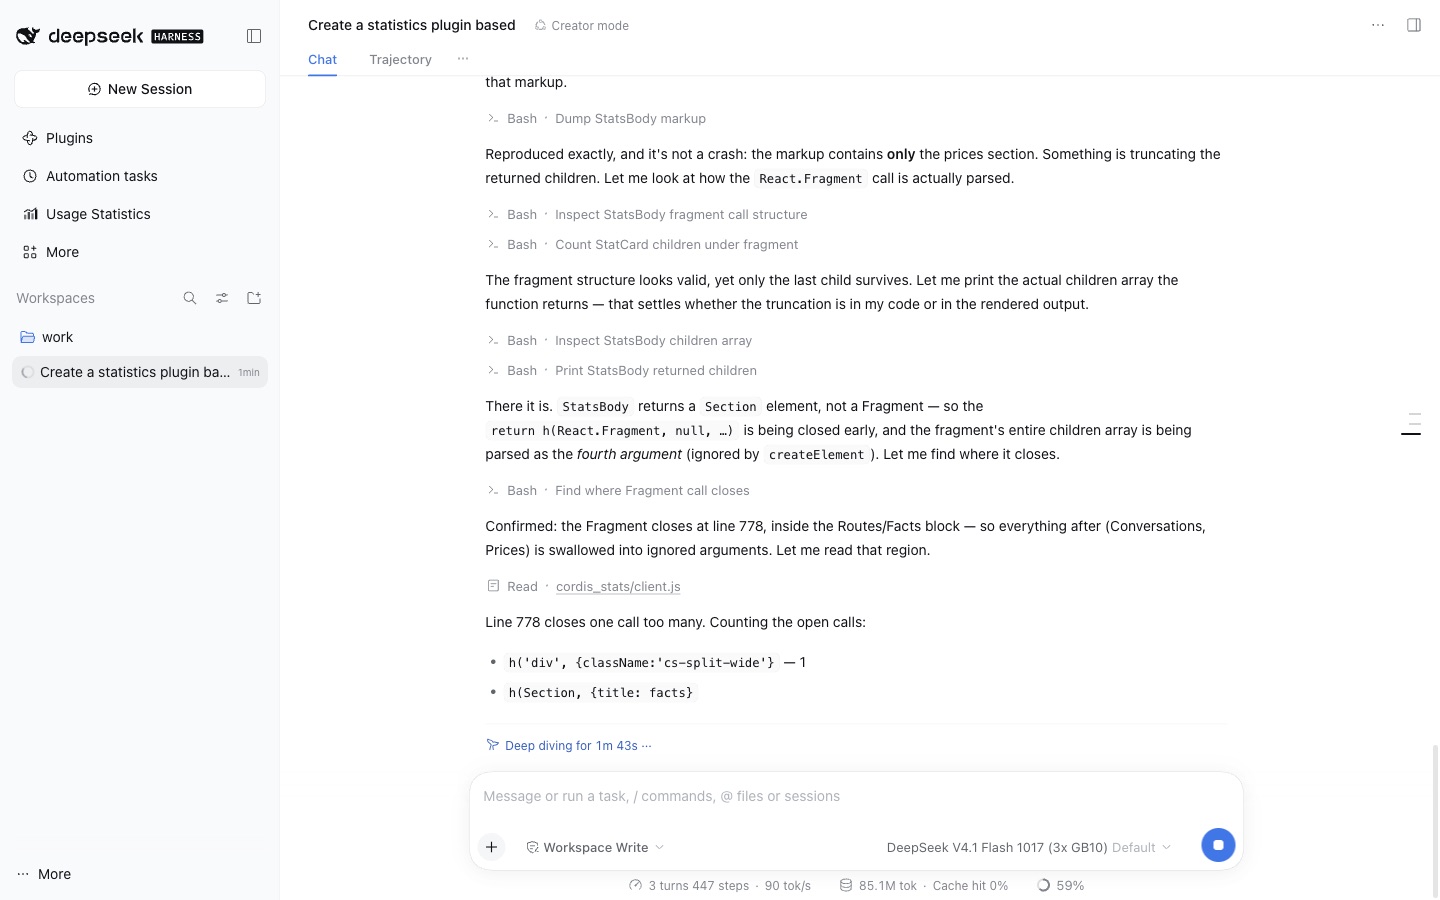
The fix was five lines. What came after is the part I would want from any contributor. It wrote a self-test that renders the page against a stub and counts the sections. Then it put the original bug back into a scratch copy to make sure the test fails without the fix. And it told me what the test does not cover: layout and dark theme are still my eyes only. While it worked, every half-edited file hot-reloaded into my open tab, which is why my console briefly filled with syntax errors.
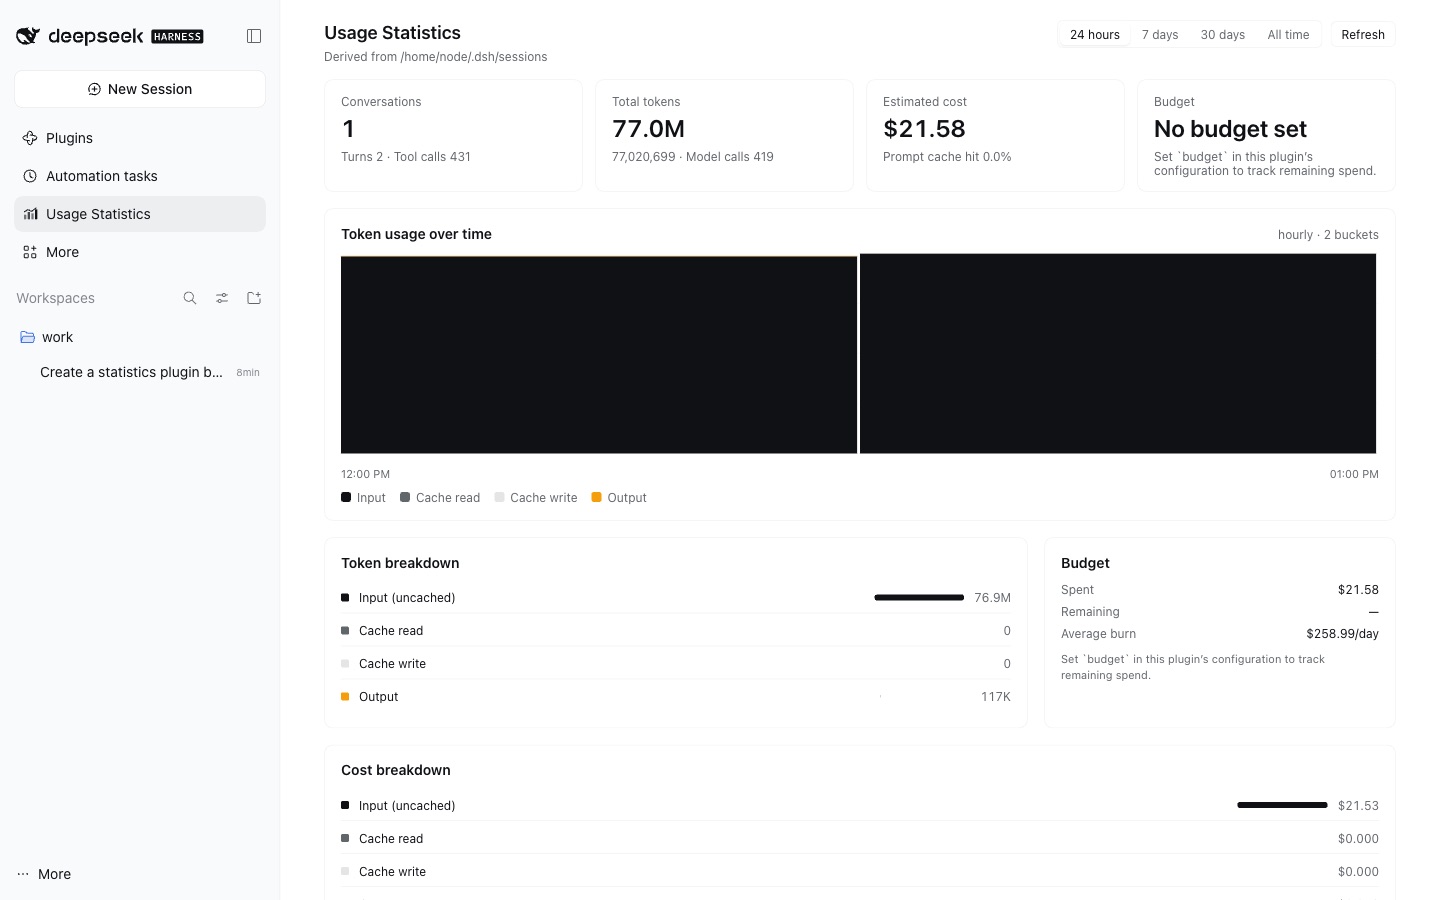
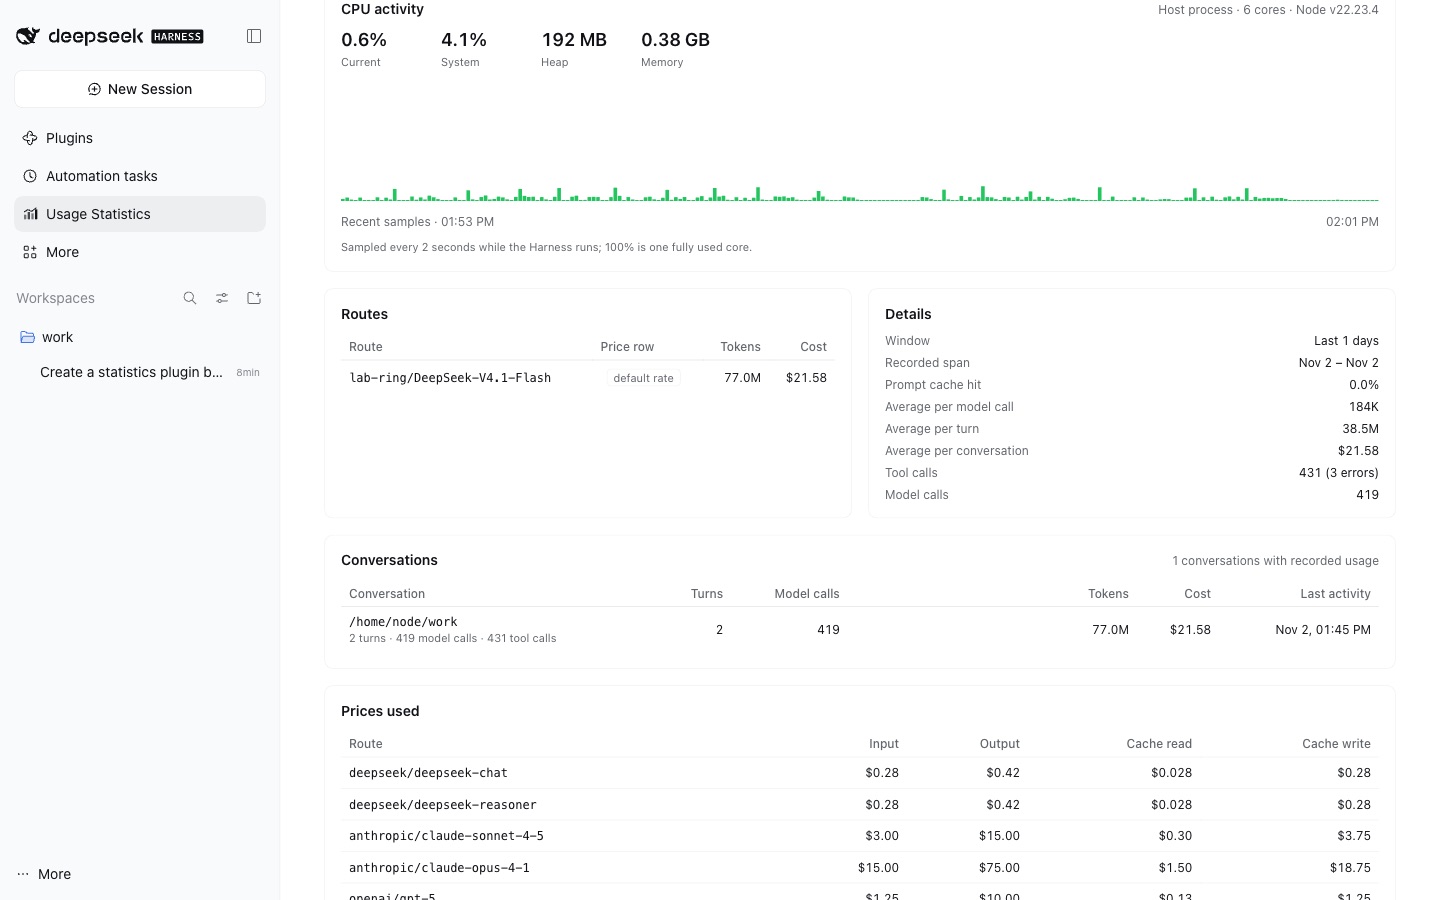
One bug is left. The page still shows the first pass only. The session log was written after the second pass, but the plugin's cache never noticed, so the third turn is missing from its totals. I am leaving that one for the next session.
The cache was 99%, not 0%
The plugin's headline numbers are 77.0 million tokens and $21.58 for the first pass. Both deserve a second look. Nearly all of those tokens are input. An agent loop resends the whole conversation on every step, so this session read about 659 tokens for every token it wrote.
The page also says the prompt cache hit rate was zero. It was not. The ring's own counters, since it booted that morning and almost all from this experiment, show the prefix cache answering 99.3% of prompt tokens. The harness reported zero because the server does not include cached-token counts in its responses, so the plugin had nothing to read and assumed nothing was cached. It then priced every input token at the full rate.
| Measurement | First pass | Second pass |
|---|---|---|
| Wall time | 1 h 12 min | 7 min |
| Steps | 423 | 96 |
| Tokens | 77.0M, 116,770 of them output | 30.7M |
| Approval prompts | 22 | 0 |
| Cost the plugin estimated | $21.58, every input token uncached | not counted |
| Same tokens at API cache pricing | about $2.30 at the ring's 99.3% hit rate | not counted |
Both dollar figures are API list prices for tokens that never touched an API. On my hardware the marginal cost was power, plus a slice of three machines I already own. That gap, between what a token would cost on someone else's meter and what it costs on yours, is the thing InferCost exists to measure, and this plugin is a neat demonstration of why the default answer is wrong.
What I would tell the next person
- Run Creator Mode in a container with nothing worth taking. Bake
pnpminto the image so the agent does not have to fetch one. - Set
DSH_TELEMETRY_MODE=DISABLEDif your sessions should stay on your machine. - For a custom provider, give the harness an
apiKeyEnveven when your gateway reads the key from a different header. - For DeepSeek on vLLM, use
thinkingFormat: chat-templatewithchatTemplateKwargs.thinkingbound tothinking.enabled. - Read the code before you approve an install. Expect a lot of reload approvals after that; each edit to the plugin's server half needs one.
- Check cache numbers at the server, not in the harness. If you want the harness to see them, try
vLLM's
--enable-prompt-tokens-details, and test it with a repeated prompt, because some versions still return the field empty. - Open the page yourself before you believe it works. The agent told me it had not, and that was the most useful sentence in the session.
Where the numbers come from
Token counts, steps, model and tool calls for the first pass come from the plugin's own statistics route, checked against the harness's session footer. The second pass figures are from the harness's turn summary. The cache hit rate and prompt and generation token totals are the vLLM counters on the ring, read through the Kubernetes service proxy. The harness was DeepSeek Harness 0.2.1-rc.5, and the ring served DeepSeek V4.1 Flash (1017) with prefix caching on.