Introducing CLI Benchmarks: Test Your LLM Deployments Like a Platform Engineer

How do you know your LLM deployment is production-ready? You benchmark it. LLMKube v0.4.10 ships with comprehensive CLI benchmarking tools that let you validate throughput, test concurrency limits, and generate reports you can share with your team. Here's how it works and what we learned running it on ShadowStack.
The Problem: Flying Blind
Most teams deploy LLMs and hope for the best. They spin up a model, run a few curl commands, and call it a day. Then production traffic hits and they discover their "fast" model chokes at 4 concurrent requests, or their 32B model runs fine until someone sends a 16K context prompt.
Platform engineers need real data. They need to know:
- How does throughput scale with concurrent requests?
- What's the latency distribution under load (P50, P99)?
- How long can the model sustain continuous inference?
- Does adding a second GPU actually help?
The new llmkube benchmark command answers all of these questions automatically.
Five Test Suites for Every Scenario
Instead of requiring you to configure every parameter manually, we built five predefined test suites that cover common validation scenarios:
Each suite runs multiple phases. For example, the full suite runs a concurrency sweep (1, 2, 4, 8 concurrent requests), a max tokens sweep (64 to 2048 tokens), a context size sweep (4K to 32K), and a one-hour stress test. All automated.
Running Your First Benchmark
Getting started is straightforward. Deploy a model from the catalog and run a suite against it:
The CLI handles everything: deploying the model, waiting for it to be ready, running the benchmark phases, and generating a markdown report with all the results.
Real Results from ShadowStack
We ran these benchmarks on ShadowStack, our on-prem testing rig with dual RTX 5060 Ti GPUs (32GB VRAM total). The hardware cost under $2,500, but it lets us test production scenarios that would cost $30,000+ on datacenter GPUs.
Qwen 2.5 32B: Full Suite Results
We ran the full suite against Qwen 2.5 32B using both GPUs. Total runtime: just over 2 hours.
Concurrency Sweep
| Concurrent | Gen tok/s | P50 | P99 | Status |
|---|---|---|---|---|
| 1 | 17.6 tok/s | 3.1s | 3.2s | Pass |
| 2 | 17.6 tok/s | 4.1s | 6.3s | Pass |
| 4 | 17.6 tok/s | 7.9s | 12.5s | Pass |
| 8 | 17.6 tok/s | 15.4s | 20.5s | Pass |
Notice how generation speed stays constant at 17.6 tok/s regardless of concurrency. This is expected: the GPU is fully utilized. What changes is latency. At 8 concurrent requests, P99 latency jumps to 20 seconds. This tells us that for latency-sensitive applications, we should cap concurrency at 2-4.
Stress Test (1 Hour)
Zero errors over 1,773 requests across an hour of continuous load. This is the kind of stability data you need before deploying to production.
The GPU Scaling Question
One of the most valuable insights from benchmarking is understanding when multi-GPU actually helps. We ran the quick suite on Qwen 2.5 14B with 1 GPU, then again with 2 GPUs.
Qwen 2.5 14B: 1 GPU vs 2 GPU
| Configuration | Gen tok/s | P50 | P99 |
|---|---|---|---|
| 1 GPU (16GB) | 28.5 tok/s | 1.9s | 1.9s |
| 2 GPU (32GB) | 28.4 tok/s | 1.9s | 1.9s |
The results are nearly identical. Why? Because the 14B model fits entirely on a single 16GB GPU. Adding a second GPU doesn't help because there's nothing to offload. The model isn't memory-constrained, so layer sharding across GPUs just adds communication overhead.
Resource Optimization Insight
This is exactly the kind of data that saves money. If your model fits on one GPU, don't waste the second one. Use it to run a second model, handle failover, or save it for workloads that actually need it. The scaling suite automates this comparison.
Compare this to the 32B model, which requires both GPUs to fit in memory. There, dual-GPU is essential, not optional.
Markdown Reports for Your Team
Every benchmark run generates a markdown report with all the data in a format you can commit to git, paste into a PR, or share in Slack:
Reports include host information, GPU configuration, and timestamps so you can track performance across hardware changes or software updates.
Run It On Your Hardware
The benchmarking tools we used on ShadowStack are the same tools you get with the LLMKube CLI. Whether you're running on a single RTX 4090, a dual-GPU workstation, or a cluster of nodes, the same commands work:
Every team's hardware is different. The benchmark suite gives you real data for your specific configuration so you can make informed decisions about model selection, GPU allocation, and concurrency limits.
Monitor in Production with Grafana
Benchmarks tell you what to expect. Grafana tells you what's actually happening. LLMKube v0.4.10 also ships with a pre-built GPU observability dashboard that tracks utilization, temperature, memory, and inference latency in real-time.
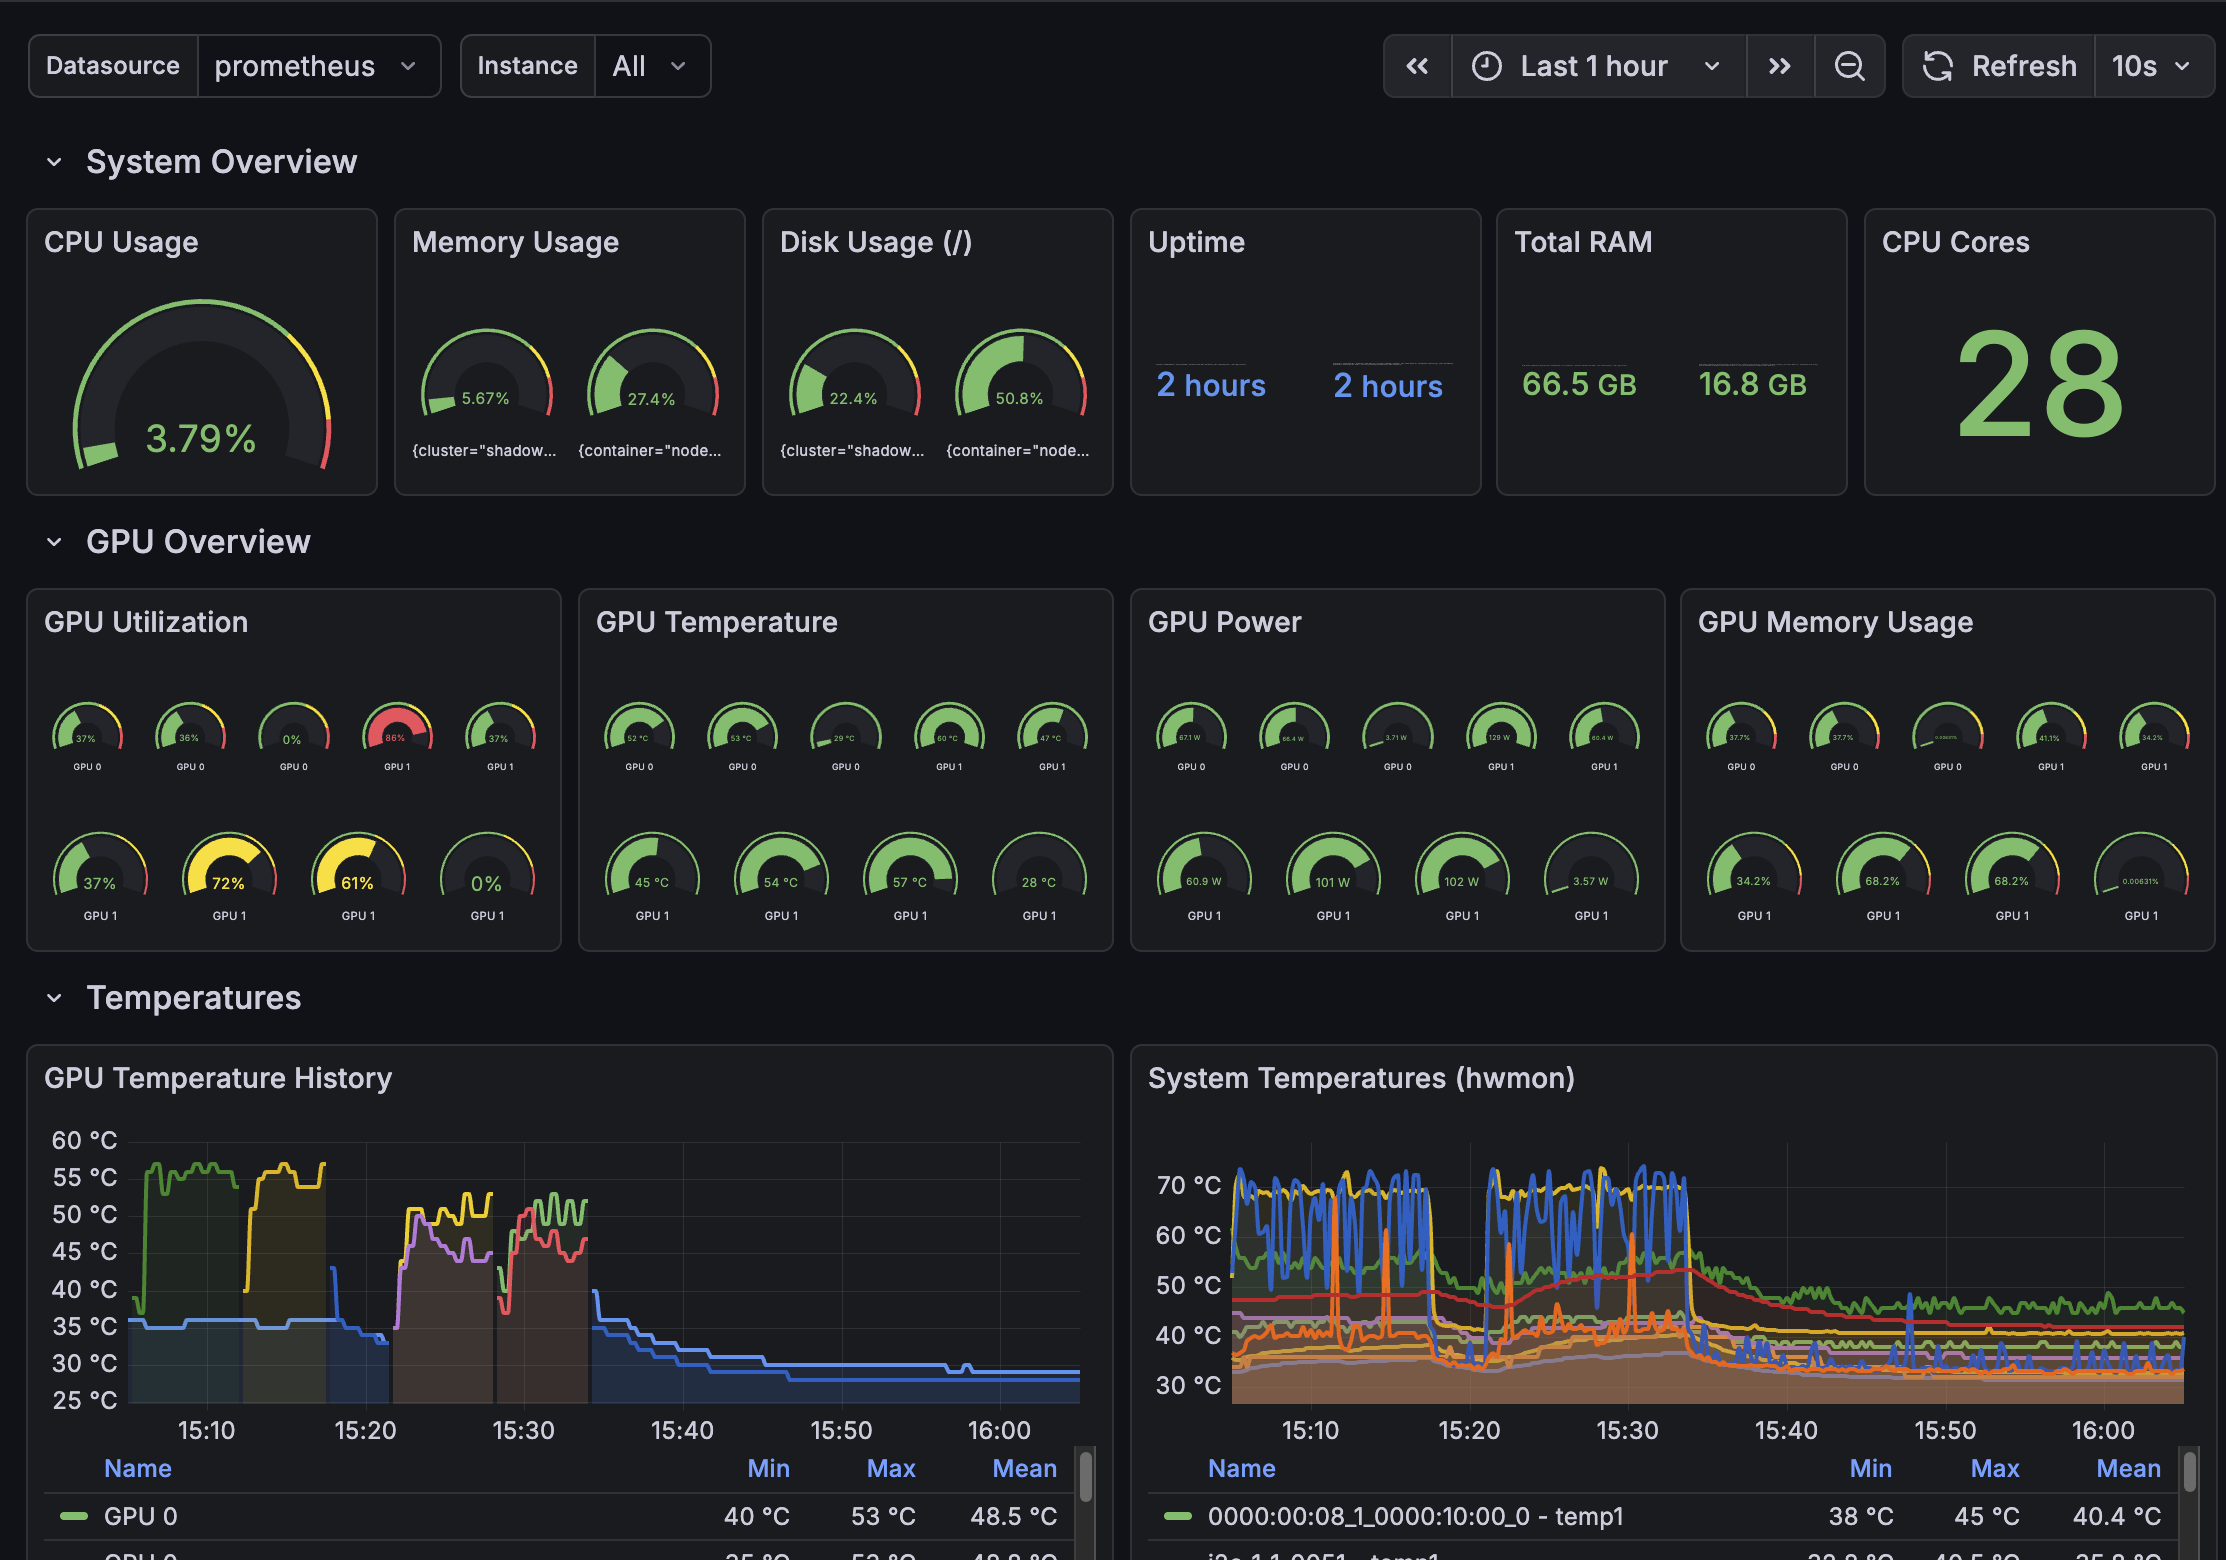
The dashboard includes system overview gauges, per-GPU metrics, temperature history, and LLMKube-specific panels for model status and inference throughput. Import the JSON from config/grafana/ in the repo to get started.
What's Next
We're planning to add:
- JSON output for programmatic analysis and CI integration
- Comparison mode to diff results across runs
- Memory profiling to track VRAM usage over time
- Thermal monitoring for long-running stress tests
If you have feature requests, open an issue on GitHub. We're building this for platform engineers who need real answers, and your input shapes the roadmap.
Try LLMKube Benchmarks Today
Install the CLI and run your first benchmark in under 10 minutes. See exactly how your models perform under load.